There is a lot that Google dev tools could do, but this article will focus on identifying unused code. And of course, there are more than one way to find dead code, but this method is simpler as it doesn’t require additional libraries.
Contents
Why Find Unused Code?
The very basic reason is performance improvement. The lesser the files, the faster the page loads.
47 per cent of consumers expect a web page to load in two seconds or less. 40 per cent of consumers will wait no more than three seconds for a web page to render before abandoning the site
Imagine all the users/customers you could lose visiting your website just because it doesn’t load in a few seconds. So it is really important that the files we send are minimal and does not contain junk.
So, How Does Coverage Tab Work?
I will be using one of my very first React piece of code I wrote for demo purpose.
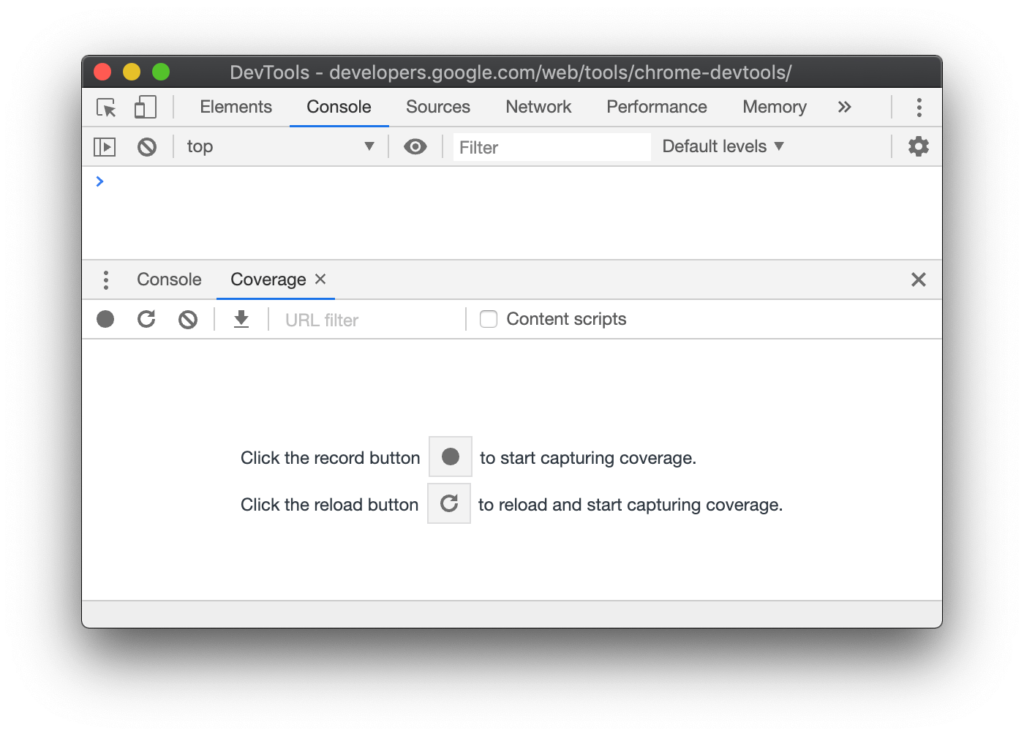
Google dev tools have a coverage tab to do the magic. Go to console, press Ctrl+Shift+P and type Coverage.

This will open up a coverage tab as below:
2. Here, you have two options to choose from. One, to see the code needed on page load. The other one is to see what code is used when a user interacts with the page. Select any one as per your requirement.
3. Once, the code coverage recording starts, you will be able to see a Red dot-like button on top left corner of the coverage tab. Use this to stop the recording and to see the final Analysis.

The report shows all the files that are used for the action performed/ page load, and how much code of each file is actually needed.
Understanding the report:
- The URL is the file that was analysed.
- The Unused Bytes column provides the amount of unused code in terms of percentage and bytes.
- The last column is the visual representation of the used and unused code. The red being unused code.
The scenario that pushed me to look for the Coverage tab:
1. What happened in our project is that we had all the CSS required for the entire app written on a single file. As a result, the initial load time was longer.
We then split the required CSS to separate files based on the styles that the components required.
2. The other scenario is when we use a common library and link its path up in parent file(cuz we are all lazy to link it in only required place at times). This will result in passing down to all the pages when they don’t really require it.
Bonus Development Tool tip:
We as developers have access to a blazing-fast internet connection. But when it comes to websites, especially public sites, a majority of the users access the sites from their mobile.
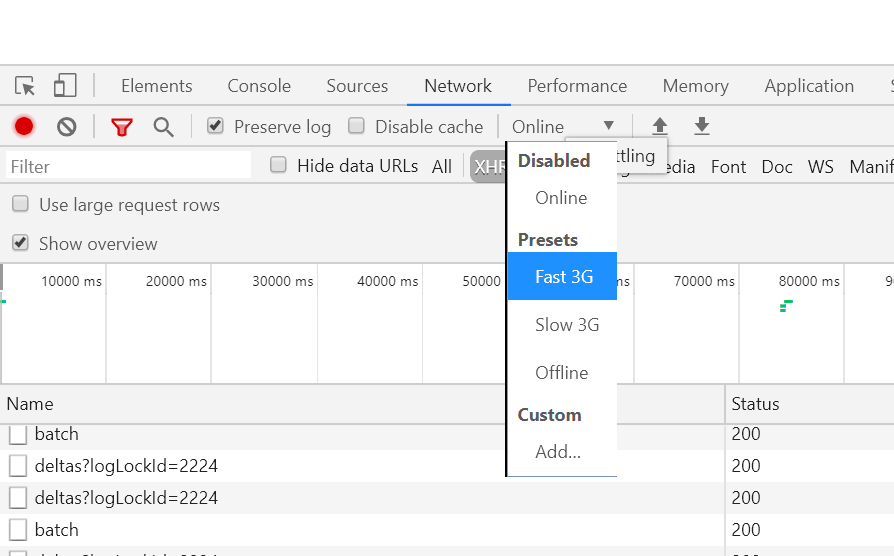
To test the performance of your site at the speed of mobile data, you can go to Networks tab and select a speed from Throttling dropdown.
Credits – https://developers.google.com/web/tools/chrome-devtools/coverage


